Visualizing Thought: The Story Behind Obsidian's 3D Graph Plugin
# Introduction: A New Dimension for Your Notes
Every Obsidian user knows the power of the graph view. It’s a fantastic tool for seeing the connections between our notes, but as our vaults grow, so does the complexity. What if we could add another dimension to our exploration? This question was the spark that led to the creation of the 3D Graph plugin for Obsidian.
This post will take you on a journey through what the plugin does, how some of its most complex features were built, and why viewing your notes in 3D can unlock a new level of insight into your own knowledge base.
# What is the 3D Graph Plugin?
At its core, the 3D Graph plugin transforms your Obsidian vault from a 2D map into a living, interactive 3D universe. It renders your notes and their connections as nodes in a dynamic, force-directed graph that you can rotate, pan, and zoom through.
The goal is to provide a powerful, high-level overview of your knowledge, helping you discover surprising connections, identify clusters of thought, and find forgotten, orphaned notes.
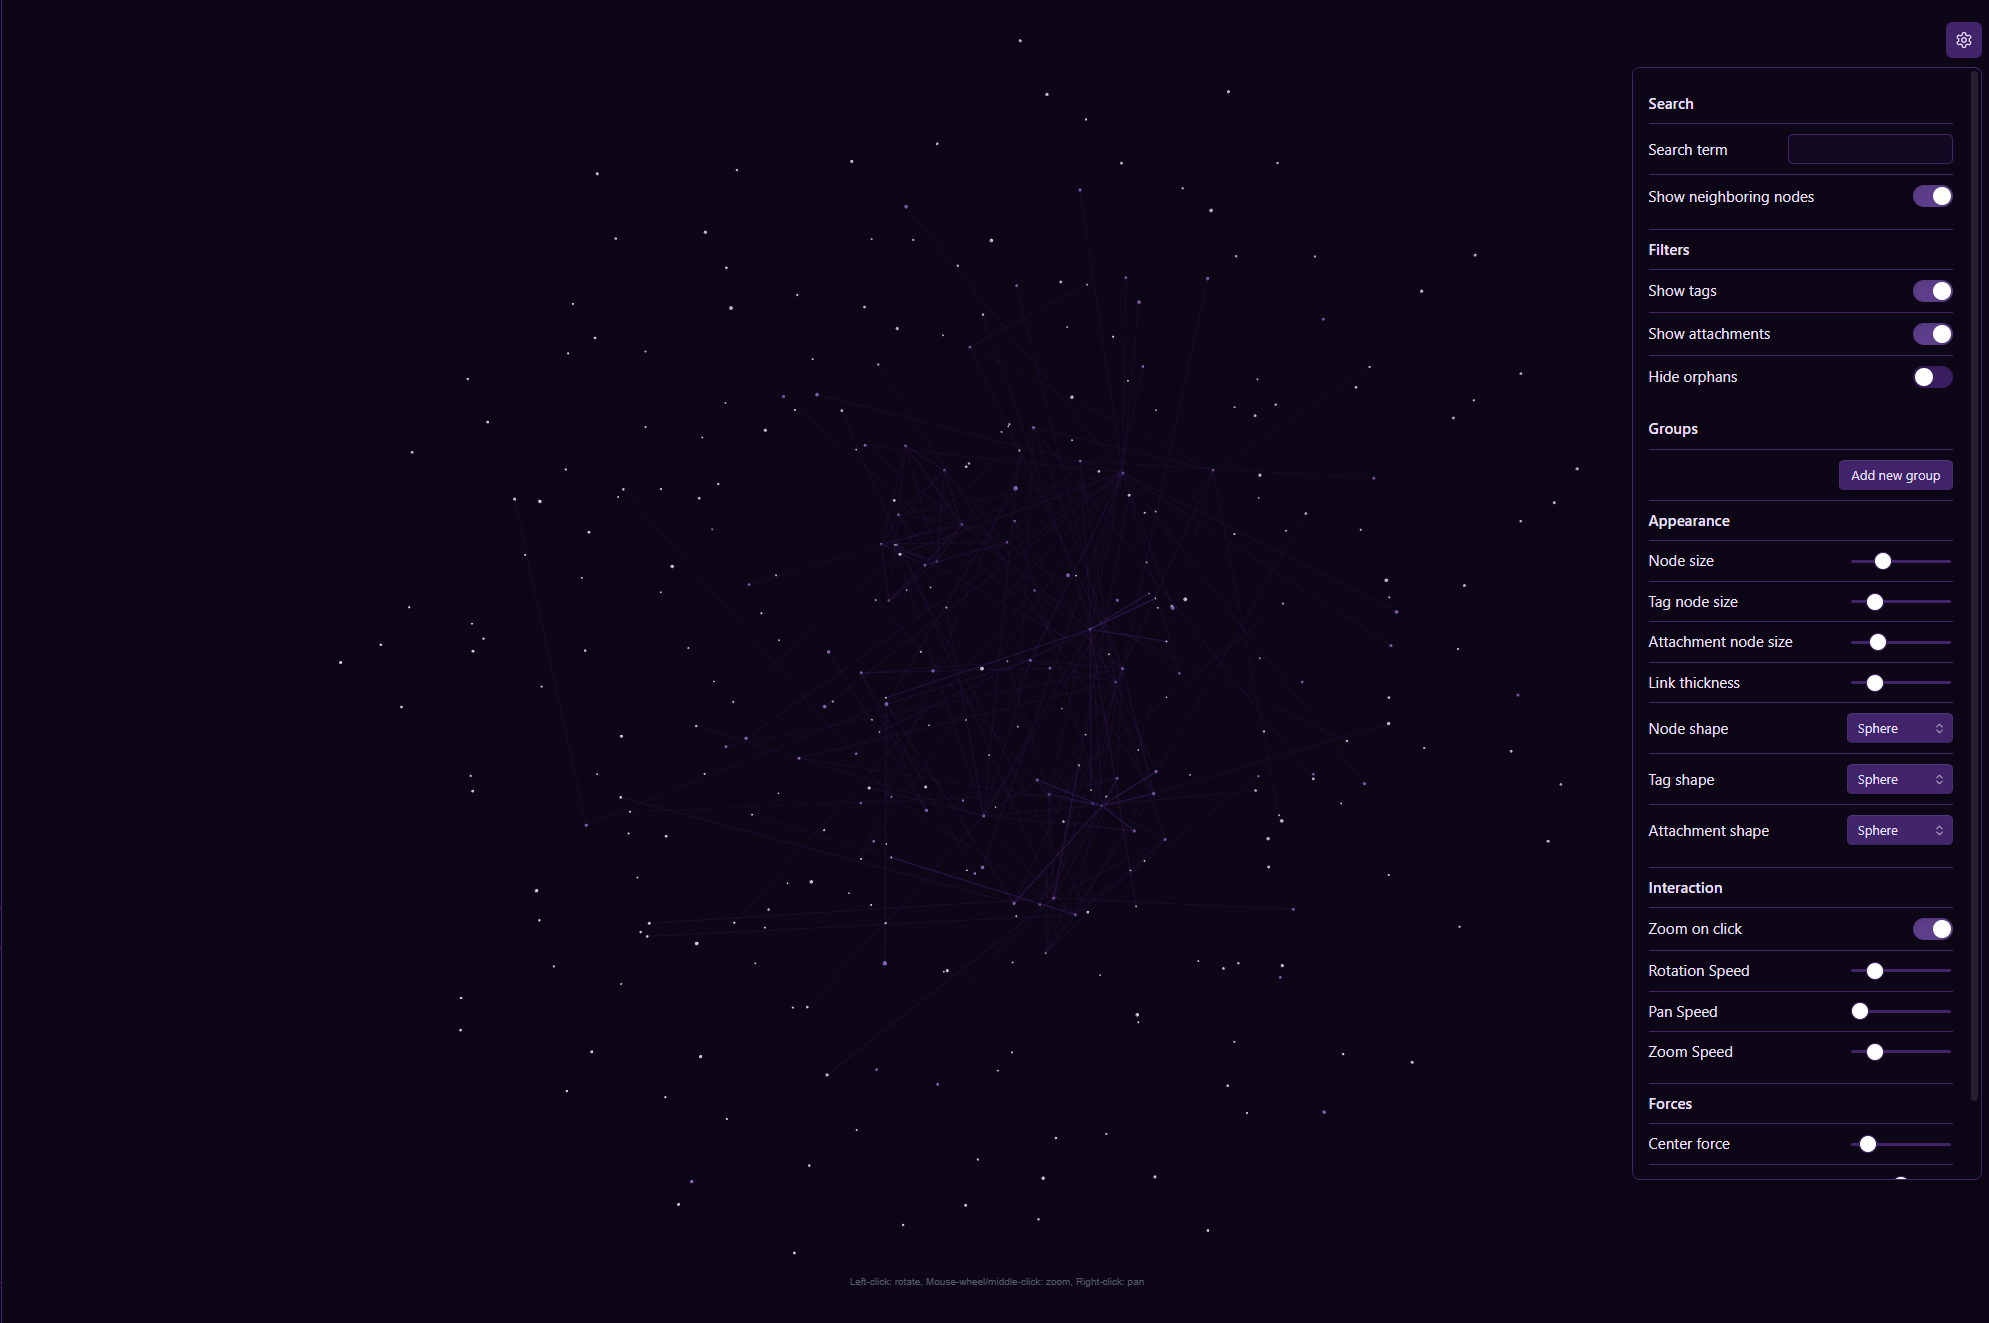
Key Features:
- Live, Interactive 3D Graph: Explore your vault’s structure in a three-dimensional space.
- Powerful Filtering: Instantly filter the graph by search terms, tags, folders, and even hide attachments or unlinked “orphan” notes.
- Deep Customization: Use the “Groups” feature to apply custom colors to nodes based on flexible rules, and change the shape and size of different node types to create a view that makes sense to you.
- Live Settings Panel: A floating settings panel allows you to adjust almost every aspect of the graph—from physics forces to node appearance—in real-time, without ever leaving the view.
# The Developer’s Journey: How It Was Built
Every feature comes with its own set of challenges. Here’s a look behind the curtain at how two of the most significant technical hurdles were overcome.
# Challenge #1: The Color Conundrum
One of the first pieces of major feedback was that the graph’s colors were breaking on certain Obsidian themes.
The Problem: The plugin was using a standard web function, getComputedStyle, to read color values from the user’s theme. However, modern CSS is incredibly flexible. Themes can define colors in many formats, from simple hex codes (#ff0000) to complex, calculated values like color-mix(in srgb, blue 40%, white) or lab(64 0.01 -0.0008). The getComputedStyle function doesn’t always return a simple, predictable format, which caused the Three.js rendering engine to fail.
The Solution: How do you reliably find the final color of an element, no matter how it’s defined in CSS? The answer came from a clever, dependency-free browser trick: use a canvas.
The refined process works like this:
// A simplified look at the color conversion logic
function getCssColor(variable, fallback) {
    // 1. Get the computed color string, e.g., "lab(64...)"
    const tempEl = document.createElement('div');
    tempEl.style.color = `var(${variable})`;
    document.body.appendChild(tempEl);
    const computedColor = getComputedStyle(tempEl).color;
    document.body.removeChild(tempEl);

    // 2. Use a canvas to do the conversion
    const canvas = document.createElement('canvas');
    canvas.width = 1;
    canvas.height = 1;
    const ctx = canvas.getContext('2d');

    // 3. The browser calculates the final color when filling
    ctx.fillStyle = computedColor;
    ctx.fillRect(0, 0, 1, 1);

    // 4. Read the standardized RGBA value from the pixel
    const [r, g, b] = ctx.getImageData(0, 0, 1, 1).data;
    return `rgb(${r}, ${g}, ${b})`; // e.g., "rgb(128, 0, 128)"
}
This approach made the plugin instantly compatible with a much wider range of beautiful community themes.
# Challenge #2: From Static to Dynamic
Initially, all settings lived in Obsidian’s main settings area. While functional, it was a clumsy user experience. Adjusting a force or changing a node size required navigating away from the graph, making the change, and returning. It broke the flow of exploration.
The Problem: How do you create a settings experience that is immediate, interactive, and doesn’t require a full graph reload for every minor tweak?
The Solution: The answer was to build a second, “local” settings panel directly inside the graph view itself.
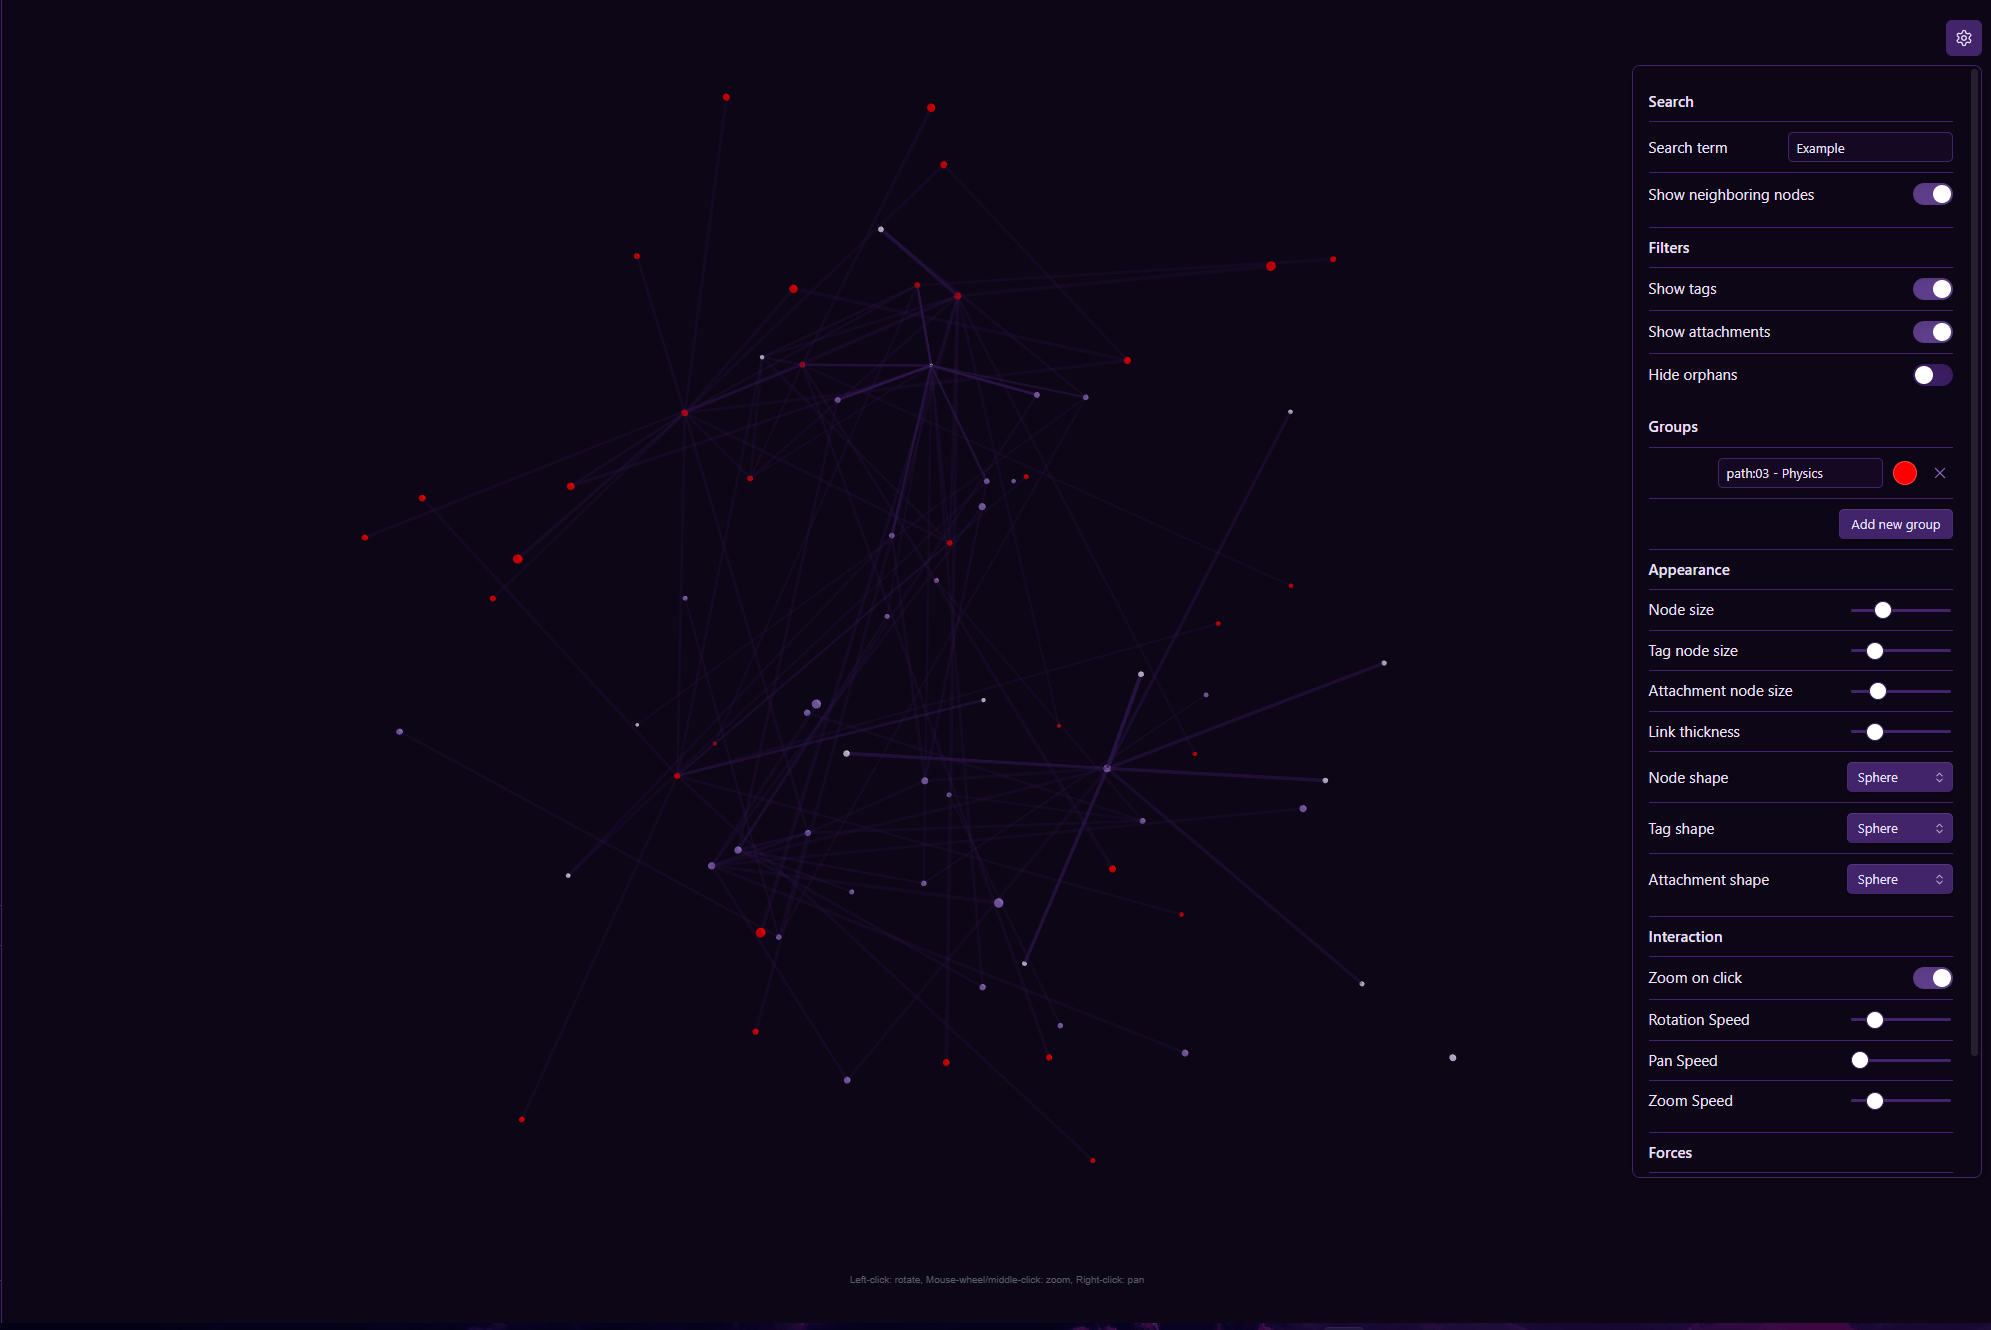
- UI Construction: Using Obsidian’s built-in UI components (
Setting,addSlider,addToggle, etc.), a floating panel was constructed dynamically when the view opens. - Instantaneous Updates: Each control in this new panel is wired directly to update specific aspects of the graph. For example:
- Changing a force slider directly calls the
d3Forceupdate methods. - Adjusting a size slider or shape dropdown triggers a display update that re-renders the node objects without recalculating the entire graph layout.
- Changing a force slider directly calls the
- Performance Matters: To ensure these real-time updates remained fast, a simple caching system was added. For repeated operations like looking up theme colors during a single render, the result is stored after the first lookup and reused, preventing redundant calculations on large graphs.
# The Future is Collaborative
The 3D Graph plugin is a continuing exploration, driven by the needs and ideas of the Obsidian community. There is always more to improve and new features to imagine.
If you’re interested in visualizing your notes in a new way, I encourage you to install the plugin and give it a try. For a deeper dive into the code, to report an issue, or even to contribute your own ideas and improvements, check out the project on GitHub. Your feedback is invaluable in shaping the future of this tool.
Github Repository - Don’t forget to leave a star!
Thank you for reading, and happy exploring!